Insider Threat Program Metrics for Executive Reporting
Most insider threat programs report activity, not risk.

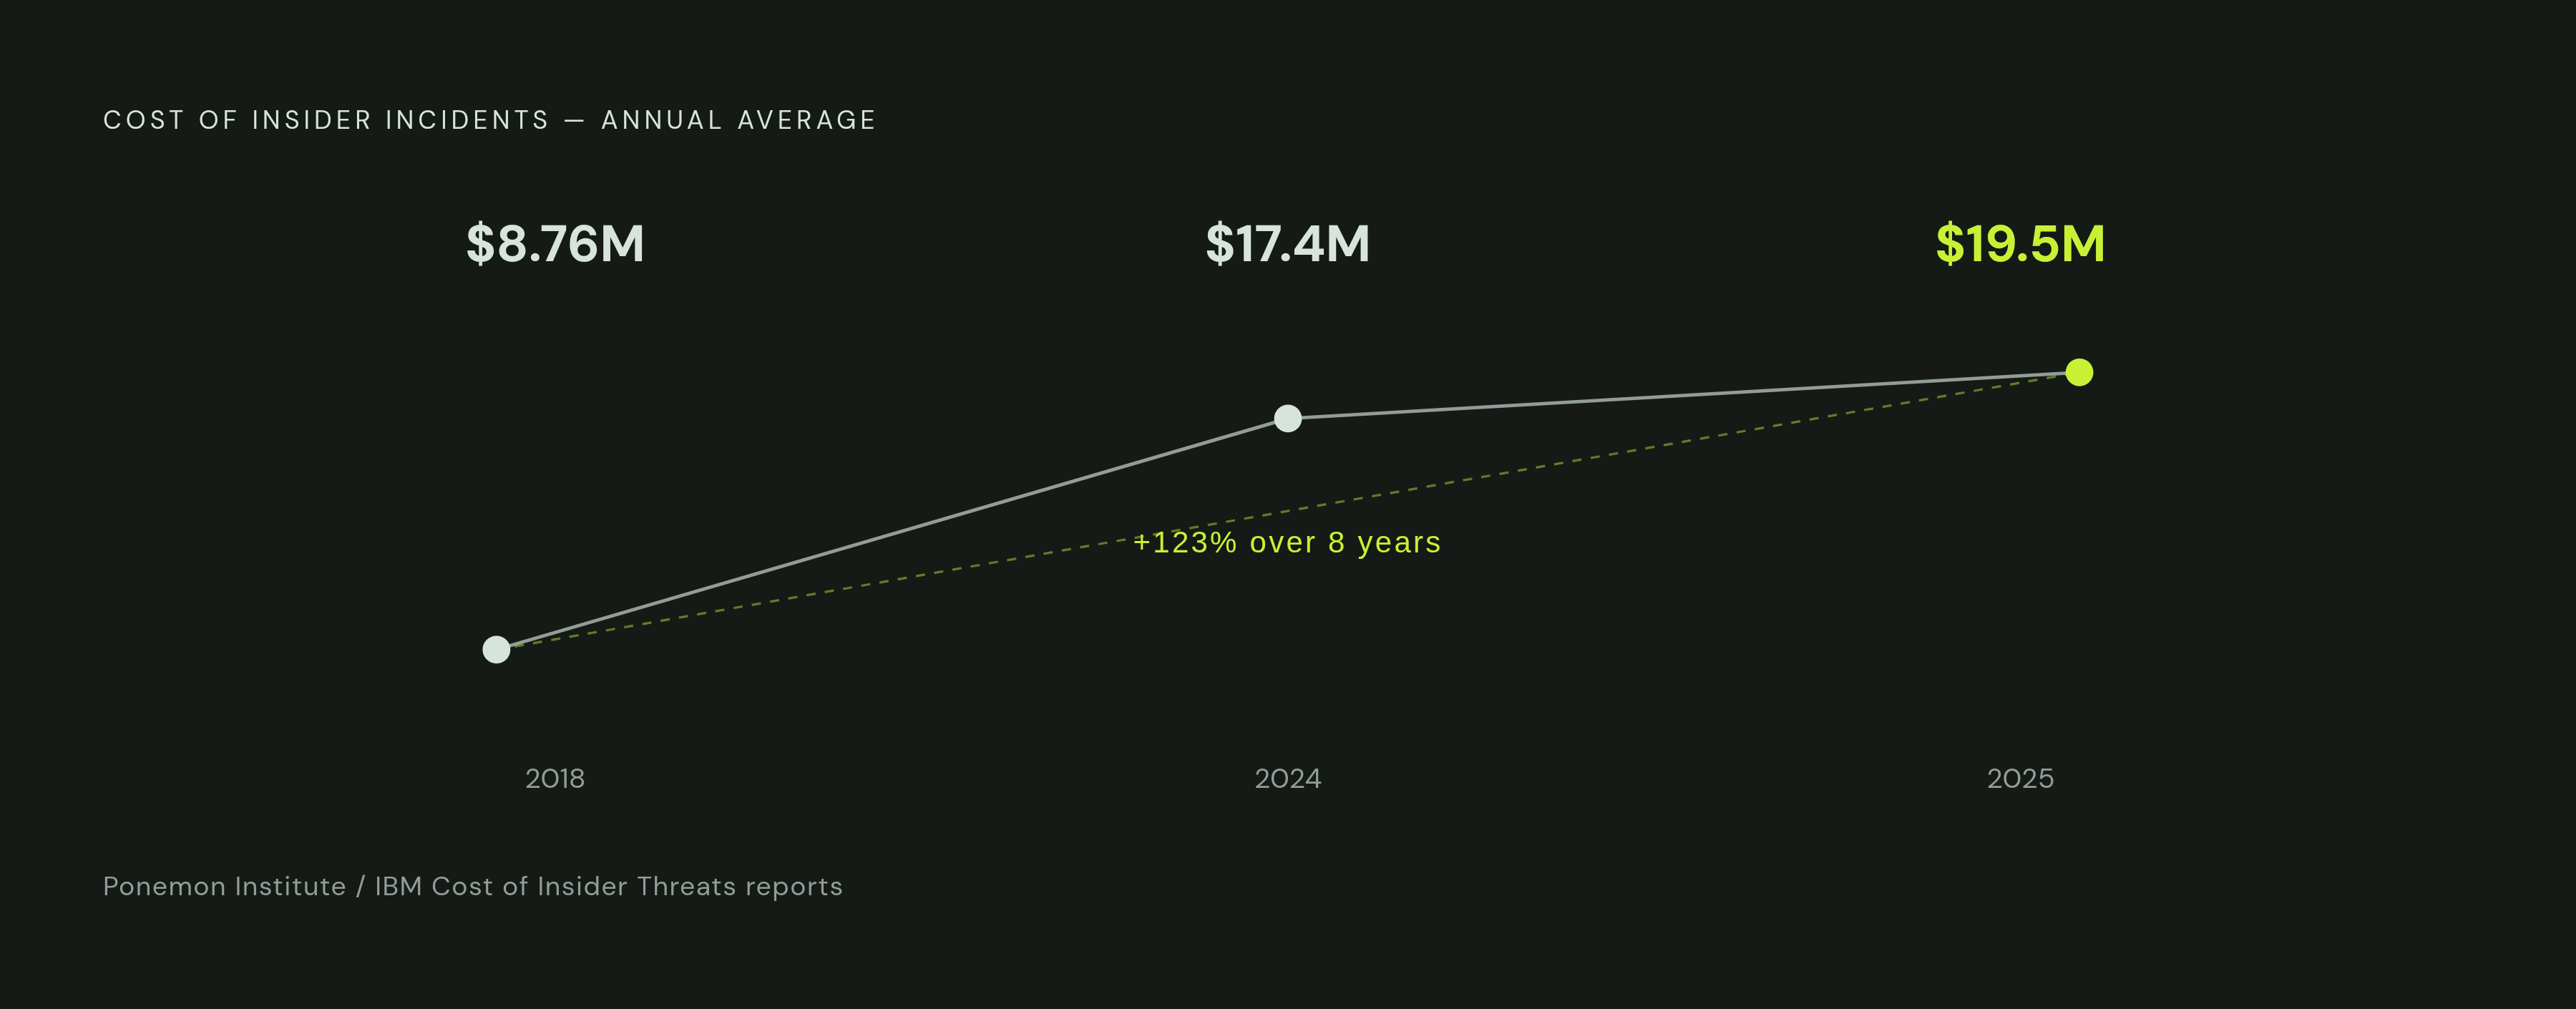
The Cost of Insider Risks Global Report puts the average annual cost of insider incidents at $19.5 million, up from $17.4 million in 2025 and $8.76 million in 2018. That's a 123% climb in eight years, and most insider threat programs still can't tell their own leadership what the number means for them. The metrics they report track activity. They don't connect that activity to risk, and that's the gap this piece is about.
Ponemon found that organizations in one region carry the heaviest load, with average annual costs reaching $24.0 million in 2025. That figure covers more than stolen files: investigation hours, containment work, remediation, legal response, and the business disruption that drags into the following quarter. Tell a board "14 insider incidents this quarter" without that context, and nobody in the room can tell if 14 is an improvement or a warning sign.
Only 25% of organizations have what Ponemon calls a fully mature insider risk program, meaning defined metrics and real executive oversight. Three out of four boards, in other words, are governing a risk category they have no reliable way to measure. That's the real finding here, and it's the one most programs would rather not sit with.
What makes insider threat reporting hard to get right
Security teams and executives speak two different languages about the same problem. Security naturally produces operational metrics: alerts fired, policies triggered, endpoints under watch. Executives need something else: has exposure gone down, were incidents actually prevented, is investigation getting faster. Most reporting breaks down in translation between those two vocabularies, before anyone even reaches the numbers.
75% of insider incidents are non-malicious. They come from negligence and compromised credentials, not employees deliberately trying to cause harm, and that single fact should reshape how any program measures itself. A program built to report only "bad actors caught" is measuring a quarter of the actual risk surface and calling it complete.
The tooling gap makes this worse, and most reports quietly skip over it. 52% of organizations say they lack the tools to handle insider threats with any confidence, and 56% say they don't have real visibility into who's touching sensitive data and how. Those two shortfalls don't just weaken defenses. They undermine whatever gets reported upward. A coverage metric built on incomplete visibility is wrong, full stop, and no amount of caveat language fixes that. It's wrong, full stop, and no amount of caveat language fixes that.
Program maturity sets a hard ceiling on what a team can honestly claim. An organization with no behavioral baseline has no basis for reporting an anomaly detection rate. An organization with no defined investigation workflow can't produce a mean-time-to-investigation figure, because there's no consistent process to time. Reporting a metric a program isn't built to produce doesn't make that program look more mature. It makes the whole report less trustworthy the moment someone in the room asks how the number got calculated.
The four dimensions any complete insider risk story must cover
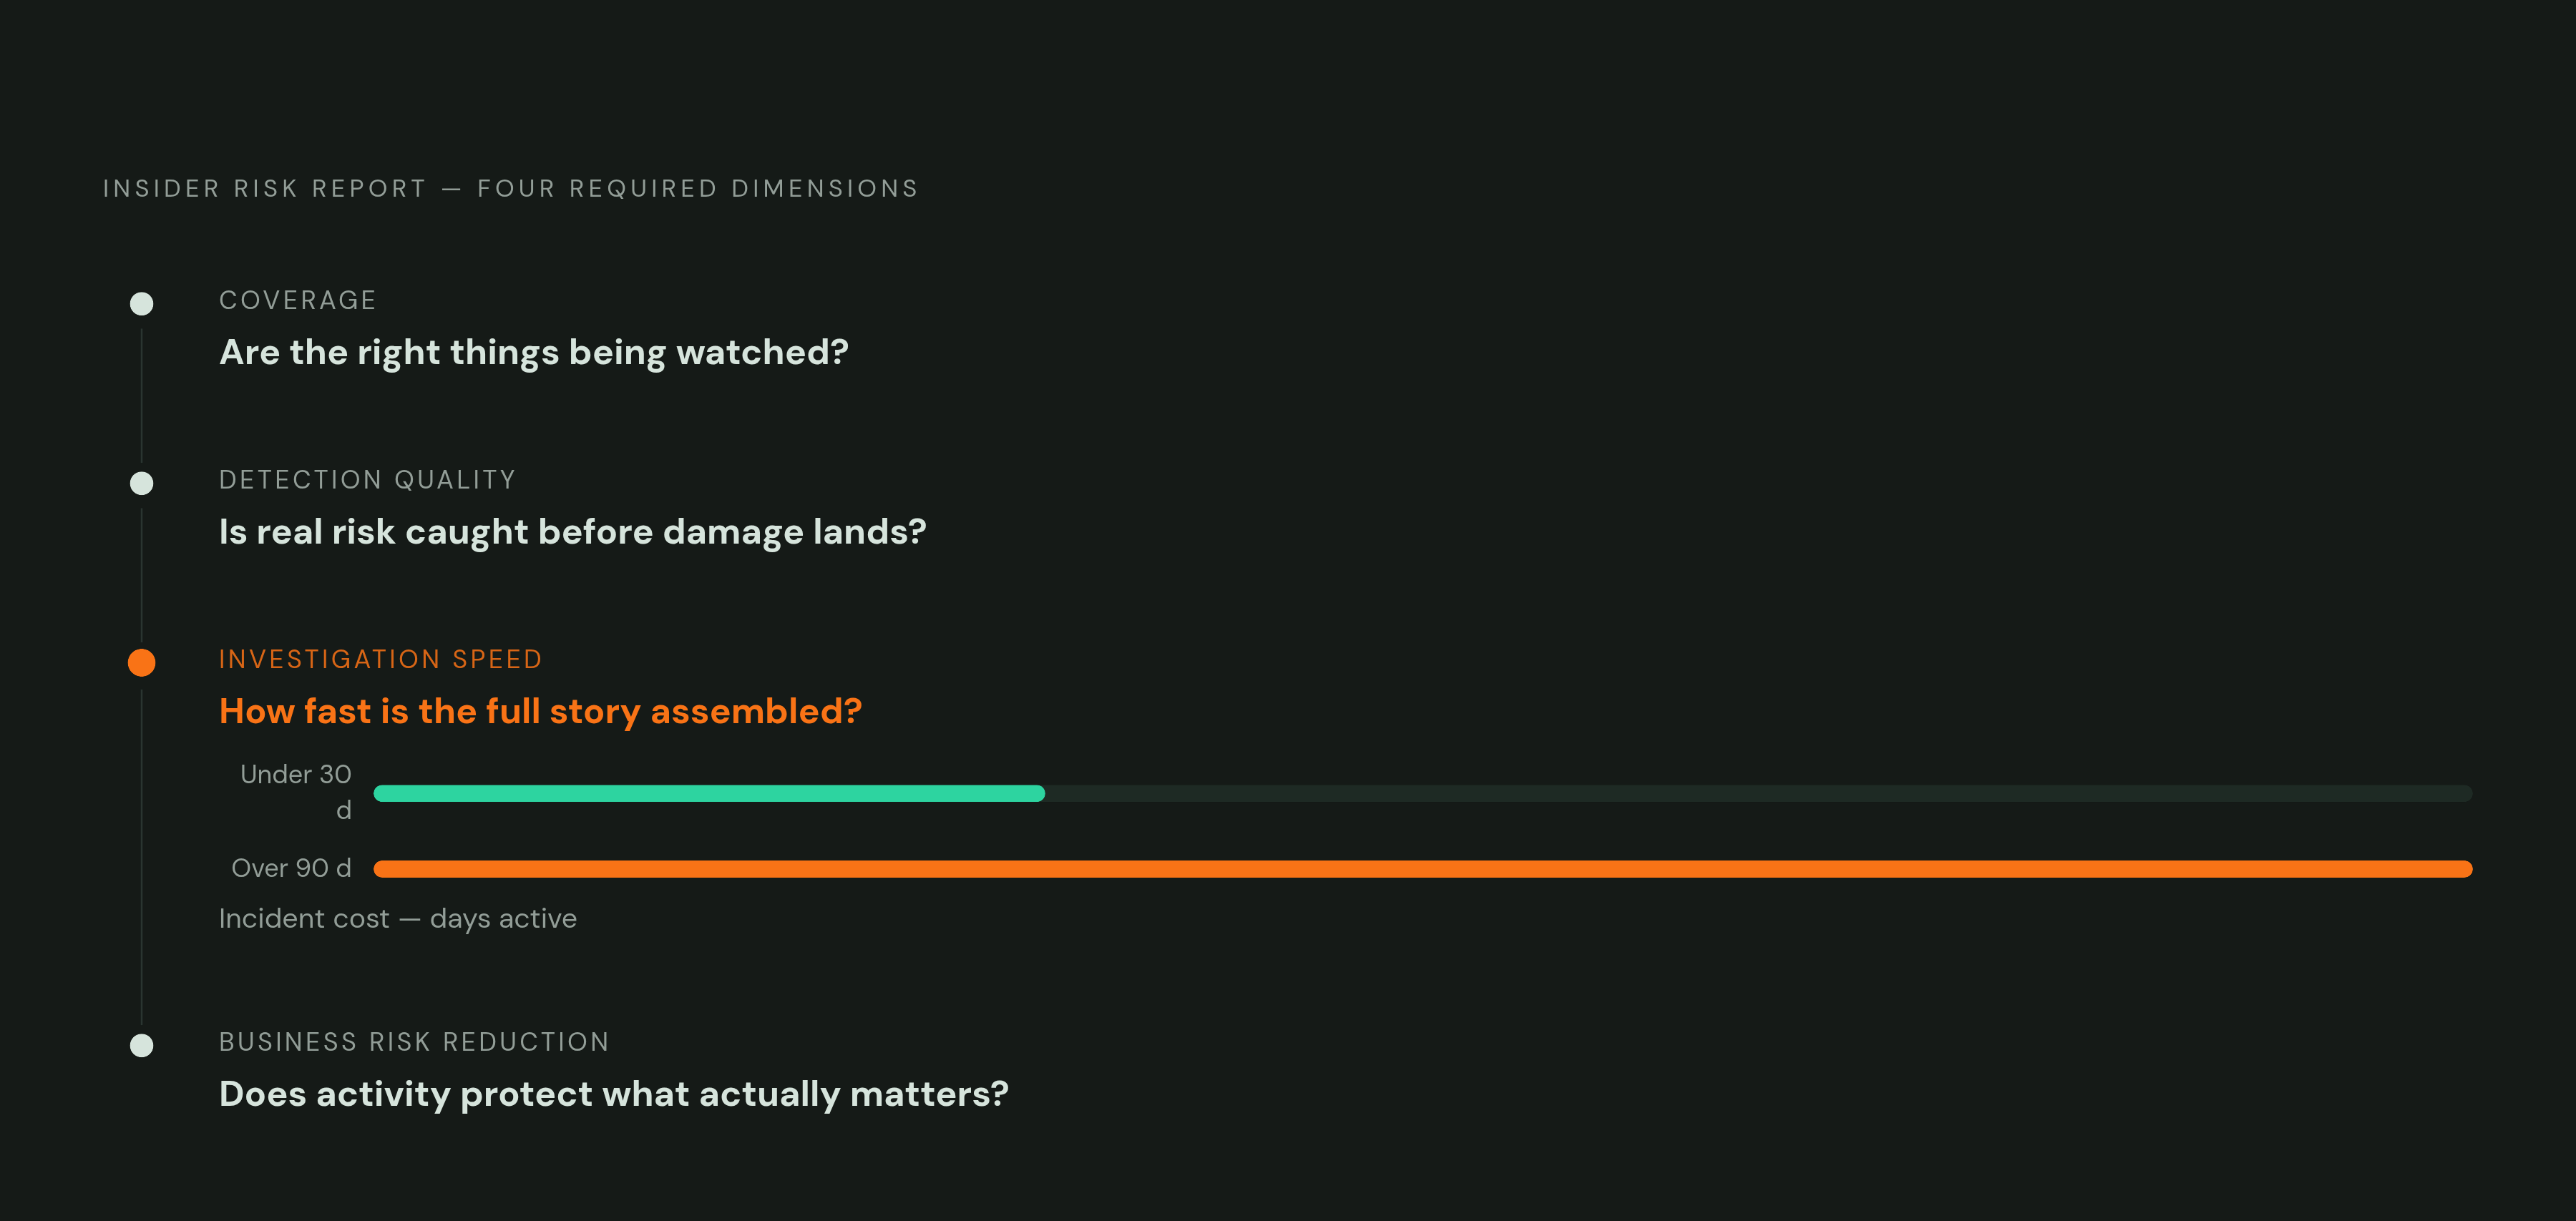
Executives don't need twenty numbers on a dashboard. They need four threads, each answering a question a board member can actually act on, and most reports fail simply because they never narrow down to these four.
Coverage asks whether the right things are being watched, and it's harder to answer than it sounds. The number of distinct GenAI SaaS applications in active use across organizations has grown rapidly, a surface area no static, rules-based system was ever built to monitor. Personal devices, unsanctioned AI tools, contractor and third-party access, and orphaned accounts left behind after someone leaves the company are where coverage gaps hide.
Detection quality asks whether the program catches something before real damage lands, and it is not the same thing as alert volume. Treating the two as interchangeable is one of the more common mistakes in this field: a legacy DLP system throwing off more alerts might mean worse coverage, not better, since it's often flagging noise it can't tell apart from real risk. Cybersecurity Insiders found that only 23% of organizations feel strongly confident in their ability to catch insider threats before significant damage occurs.
Investigation speed asks how fast the full story gets pieced together once something is caught, and this is the one with a dollar figure attached. Incidents that take more than 90 days to contain carry substantially higher costs than those resolved quickly, according to Ponemon research. That gap translates straight into executive language because it translates straight into dollars. Mean-time-to-detect and mean-time-to-investigate are separate clocks, and collapsing them into one number produces a report that looks clean while hiding exactly where the delay lives.
Coverage metrics: measuring whether the program can see the risks that exist
Coverage isn't a yes-or-no question. It has layers, and executives need at least three of them spelled out. Endpoint and cloud coverage measures the percentage of managed endpoints under watch and the percentage of cloud and SaaS environments with real visibility into data activity. Identity coverage measures how much of the active user population, including contractors, service accounts, and third parties, sits inside behavioral monitoring rather than outside it. Data type coverage measures how much sensitive information, including unstructured material like contracts, source code, and proprietary research, sits under content-aware controls rather than depending on someone having remembered to label the file.
That identity layer matters because 75% of incidents are non-malicious, driven by negligent employees and compromised credentials rather than deliberate insiders. A coverage metric that only tracks full-time employees is measuring the wrong population, and it will keep being wrong no matter how precise the rest of the math looks.
Shadow AI deserves its own line item in any coverage report, ahead of the footnotes. A measurable share of employees routinely access GenAI systems on corporate devices using non-corporate accounts, a specific form of out-of-policy exposure that most legacy monitoring never sees.
What belongs in front of an executive is a coverage gap tied to a named risk category, something like: contractors make up a given share of the workforce but sit outside current behavioral monitoring. That framing gives a board member something to act on. A raw percentage on a slide gives them nothing.
Detection quality metrics: distinguishing signal from noise in what gets flagged
Alert volume measures activity, not detection quality, and mistaking one for the other is probably the single most common failure in insider risk reporting. A program firing off more alerts hasn't necessarily gotten better at anything. Reporting the raw count as a win is how a lot of these programs lose credibility with a board the first time someone asks a follow-up question.
A handful of metrics actually earn their place here. True positive rate answers the basic question of what share of flagged events turn out to be real risk rather than noise, and every false positive eats analyst time that could have gone toward a genuine investigation, a persistent cost that legacy DLP systems have long imposed on security teams. Time to first detection measures how quickly a program catches risky behavior after it starts. Detection coverage by threat archetype asks the more pointed thing: is the program actually catching pre-departure exfiltration patterns, orphaned account misuse, and shadow AI uploads of sensitive content, or just the categories it happened to be built around from the start?
Rule-based detection tends to produce high alert counts while missing pattern-based risk that doesn't match a predefined rule, and this is where most legacy tools quietly fail. Behavioral detection, built on learned baselines rather than static rules, is designed to reduce false positives and pick up more of the unstructured risk that rule-based systems miss. The goal to communicate to an executive is simple: fewer, higher-confidence signals, arriving already assembled into something an analyst can act on without stitching it together first.
Investigation speed metrics: measuring what happens between alert and resolution
Detection and investigation run on two separate clocks, and most programs only report on one, usually whichever one makes the program look fastest. How long before the program flags a piece of activity in the first place is what mean time to detect measures. Mean time to investigate measures how long before an analyst has enough context assembled to actually make a call. Mean time to contain measures how long from a confirmed risk to the exposure actually being shut down.
The financial case for tracking these separately is stark, and it settles the debate over the reporting overhead. Ponemon research shows incidents contained in more than 90 days cost organizations substantially more than those contained in under 30 days, a multi-million-dollar gap attributable directly to how fast the investigation moved.
What drags investigation time out in practice is rarely one bottleneck. Alert queues stack up with low-fidelity events. Investigations force an analyst to manually stitch together activity across five or six different systems. Cases open with no assembled timeline at all, so the analyst starts from zero every single time, and that alone can eat a day before real work even begins.
Good reporting on this front covers a small, specific set of numbers: average days from alert to investigation opened, average days from investigation opened to a risk decision (escalate, close, or remediate), the percentage of high-priority alerts investigated inside a defined SLA, and analyst caseload per week tracked over time. A rising caseload against flat headcount signals a structural triage problem long before it produces a missed incident, and that's exactly the kind of number a board should see before it becomes a postmortem.
Business risk reduction metrics: connecting program activity to what executives protect
A program can have solid coverage, decent detection quality, and an acceptable investigation time, and still fail at the thing the business actually cares about. None of those operational metrics automatically protects the organization's crown-jewel IP, and that gap does not close on its own just because the other three dashboards look healthy.
A handful of metrics close it instead. Breaking incidents down by category, sensitive IP, regulated data, trade secrets, customer data, versus lower-value information, tells executives what was actually at stake rather than just how many things got flagged. Estimated cost avoided, calculated against the organization's own incident history and benchmarked against the $19.5 million annual average, frames what the program prevented in terms a finance committee understands without translation. Regulatory and legal exposure deserves its own line, since incidents touching data governed by GDPR, HIPAA, CMMC, or SEC disclosure rules carry penalty scales that dwarf ordinary incident costs. Breaking incidents down by threat archetype, negligent, malicious, compromised-credential, third-party, tells leadership where policy and training dollars should go instead of spreading them evenly across a problem that is unevenly distributed.
Program ROI belongs here too. Research indicates that organizations running a dedicated insider risk program avoid a meaningful number of incidents per year, a benchmark executives can use directly when weighing whether the program's budget is earning its keep.
The 25% maturity figure from Ponemon ties all of this together. Reaching that tier requires the ability to report on business impact alongside activity. The money is already moving that direction: a strong majority of organizations report that their insider risk budgets are increasing. The programs that can draw a straight line from activity to business outcome are the ones that keep justifying that growth. The ones that can't are the ones whose budgets get questioned first, and deserve to be.
How to structure the executive report itself
Bad executive reporting fails in one of three ways. It buries the narrative under operational tables, it presents numbers with no trend context attached, or it reports everything available with no clear "so what" at the end of any of it. Any one of these three gets the report skimmed once and ignored after that.
A workable structure starts with a one-page executive summary: a program health scorecard across the four dimensions, coverage, detection quality, investigation speed, business risk reduction, using a simple status indicator and one sentence of interpretation for each. Next comes a short risk narrative, two or three sentences on the most significant insider risk development of the period (a near-miss, a shift in pattern, an emerging threat archetype), written in plain business language rather than security jargon. A trend section follows, showing the key metrics across the last three or four reporting periods, because executives need to see where a number is heading as well as where it sits today. Last comes an investment and gap section, laying out where coverage currently falls short, what closing that gap would take, and what the financial exposure looks like if it stays open.
Cadence matters as much as structure. Quarterly board-level summaries paired with monthly operational reviews for security leadership work better than trying to serve both audiences with one document. The board version should hold fewer than ten metrics and should lead with business impact, not activity counts. Reporting every available metric instead of the right few, using technical language without translating it, and failing to tie each number back to a business outcome an executive actually cares about are the three mistakes that occur most often, appearing in board and committee reports alike, and all three get fixed with a bit of editing discipline rather than a new tool.
How detection and investigation platforms change what programs can report
Legacy DLP creates a structural problem for reporting, not just a technical one. It generates alert volume with little risk context attached, so most of its output needs heavy manual triage before it's fit to put in front of an executive. Static, rule-based controls tend to produce high false positive rates, while AI-driven, behavioral systems cut those false positives substantially, which directly improves the signal quality a program actually has to report.
Gartner has stated the underlying limitation: conventional DLP cannot effectively manage GenAI data loss risks, including exposure through encrypted traffic, intent blindness, and shadow AI. Programs still relying solely on legacy DLP carry a coverage gap that keeps widening, and no amount of careful language in the quarterly report talks that gap away.
Behavioral detection platforms make a different kind of reporting possible. Instead of a list of individually triggered events, they produce a user-level risk timeline across a full reporting period, giving an analyst, and eventually an executive, a continuous picture of behavior instead of a scattered pile of disconnected alerts. That shift, from isolated triggers to assembled context, is what lets a program report investigation-ready findings instead of raw activity counts. A metric that sounds impressive on a slide is not always one that survives the moment someone in the boardroom asks how it was measured, and that's the test every number in this report should have to pass before it goes in.